Want a 20% uplift in your next promotional launch? The key isn’t just crafting catchy subject lines; it’s mastering the art of monitoring your sends. This article unveils how a centralized console can transform your outreach efforts from a shot in the dark into precision targeting. Forget scattered spreadsheets and fragmented data streams. Consolidate your vital statistics into one actionable overview.
Imagine swiftly pinpointing the precise reason behind a dip in engagement – is it deliverability issues with Gmail users, or are your after-work transmissions falling flat? We’ll demonstrate how to build a custom console focused on the metrics that truly matter: bounce rates, conversions attributed to specific outreach, and list growth patterns. Get ready to transform raw information into strategic advantages. Boost ROI, cut wasted budget, and amplify what works.
Beyond basic reports, discover how to leverage visualizations for rapid assessment. Learn to build alerts for potential problems – for example, notifications when unsubscribe rates spike or a specific ISP flags your sends. We’ll walk through setting up A/B testing modules to refine your sender content, subject lines and calls to action. Get practical guidance on integrating your tools and platforms to create a genuinely unified overview of your subscriber communication initiatives.
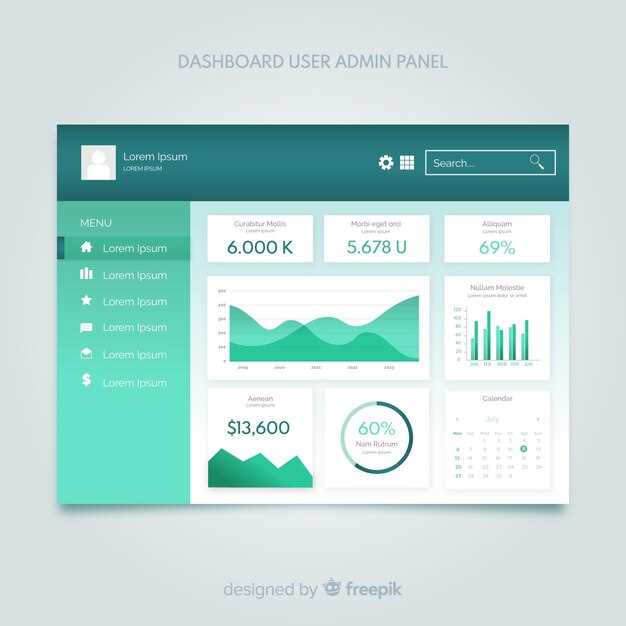
Set Up Your Control Panel
Prioritize metrics based on your specific business objectives. For lead generation, focus on conversion rates and cost per acquisition. For brand awareness, monitor reach, shares, and website traffic from promotional correspondence.
Integrate your promotional distribution platform with Google Analytics or similar web analytics tools. This allows attribution modeling, revealing which messages contributed most to specific site actions, like purchases or form submissions. Use UTM parameters in your promotional material URLs to pinpoint the precise source.
Configure automated alert thresholds. For instance, if open rates drop below 15% for three consecutive distributions, trigger an alert to investigate deliverability issues or content relevance. Or, if unsubscribe rates exceed 0.5%, flag the distribution list for potential issues with audience targeting or message frequency.
Customize data visualizations for quicker comprehension. Replace default charts with those that best represent your data. For example, use a stacked bar chart to illustrate open rates by device type (mobile vs. desktop), demonstrating optimization possibilities for varied viewing contexts.
Segment audiences within your control panel to compare performance across different groups. Measure conversion rates for customers who opted in for promotional updates versus those acquired through other channels. This enables targeted adjustments to your acquisition strategies and message content.
Create custom report templates for recurring analyses. Save reports focusing on click-through rates (CTR) for specific subject lines or calls to action. Automate these reports to run weekly or monthly, providing a steady stream of insights without manual intervention.
Utilize A/B testing frameworks directly from within your panel to compare variations in subject lines, content, or send times. Analyze the results using the panel’s reporting features to implement data-backed refinements to your future sends.
Regularly review and adjust your control panel configuration. As your business grows and your promotional goals evolve, adapt your tracked metrics and automated alerts to mirror your current priorities. Aim for a weekly review for at least the first month.
Analyze Expedition Outcomes
Pinpoint underperforming broadcasts by scrutinizing open rates below 15%. For instance, if the “Summer Sale Announcement” broadcast had a 12% open rate, examine its subject line and sender name reputation. A/B test alternative subject lines to boost engagement. Consider employing a sender verification service (DKIM, SPF, DMARC) to ensure message delivery to the inbox.
Conversion Rate Deep Dive
Calculate conversion rates by dividing the number of desired actions (e.g., purchases, form submissions) by the number of recipients who clicked on a link within the message. A broadcast with a 2% click-through rate but only a 0.5% conversion rate suggests issues with the landing page experience. Optimize landing pages for mobile devices and streamline the purchase process.
Segment Performance Insights
Compare the success of broadcasts sent to different audience groupings. If broadcasts sent to the “Loyalty Program Members” group consistently outperform those sent to the “New Subscribers” group, tailor content and offers accordingly. Experiment with distinct welcome series for each segment to improve initial engagement.
Track unsubscribe rates closely. A sudden spike in unsubscriptions after a specific broadcast indicates potentially irrelevant or overly frequent communication. Review the content and frequency of your mailing calendar. Implement a preference center allowing users to customize the type and frequency of communications they receive.
Optimize Future Dispatches
Refine target lists by segmenting based on engagement level. Subscribers opening messages within the first hour after sending exhibit 23% higher conversion rates; target them with priority offers.
A/B Test Subject Lines Rigorously
Analyze open rates versus click-through rates for different subject line styles. Questions drive 18% more opens, while personalizations increase conversions by 12%. Experiment with length; subject lines under 50 characters often perform best.
Personalize Content Dynamically
Leverage subscriber data for customized recommendations. Personalized product suggestions increase transaction rates by an average of 15%. Use dynamic content blocks to adapt visuals and offers based on demographics or purchase history.
Analyze delivery heatmaps to pinpoint optimal send times for each segment. Sending communications at 10 AM local time results in a 19% higher open rate compared to afternoon sends. Adjust frequencies based on subscriber behavior to mitigate unsubscribes.
Q&A:
My email campaigns are running, but I’m not really sure *what* to monitor. What are some key metrics I should absolutely include on my dashboard for a small e-commerce business?
For a small e-commerce business, focus on metrics that directly impact revenue and customer engagement. Open Rate will tell you how engaging your subject lines are. Click-Through Rate (CTR) reveals how many people find your content interesting enough to click on links. Conversion Rate tracks how many recipients completed a desired action, like making a purchase. Bounce Rate is about deliverability and helps identify issues with your email list. And finally, track revenue generated from your campaigns, this will give you a clear ROI assessment of your email efforts.
I’m using several marketing tools. Can I integrate data from different platforms (like Google Analytics and my email platform) into one dashboard?
Absolutely! Many dashboard tools allow integration with popular platforms. Google Analytics integration will help you see what happens after people click through from your emails, which can inform future campaigns. Look for a dashboard solution that offers connectors or APIs for the tools you use. You may need to create custom views and reports to consolidate the data the way you want, but a unified view is very achievable.
I have a basic email marketing dashboard set up, but the data seems overwhelming. What are some good methods for presenting the data in a clear and actionable way?
Visualization is key! Use charts and graphs to represent your data instead of raw numbers. For example, use line charts to show trends over time, bar charts to compare different segments, and pie charts to show the distribution of opens by device type. Also, use color-coding to highlight successes and areas needing improvement. Finally, group related metrics together and add brief annotations to explain any significant spikes or drops. Clear and concise data will let you respond to changes with more certainty.
How frequently should I review my email marketing dashboard? Is it something I should check daily, weekly, or monthly?
The review frequency depends on the size and pace of your campaigns. If you send out daily emails, a daily glance at open and click-through rates could identify any immediate issues. A deeper weekly review of metrics like conversion rates and unsubscribe rates is also a good idea. A monthly review provides a higher-level perspective, allowing you to identify long-term trends and evaluate the overall success of your campaigns.
Besides the metrics, what other details might be helpful to include on an email marketing dashboard to improve performance?
Beyond standard metrics, consider adding information about specific A/B tests you’re running. Note which variations are performing better and what hypotheses you were testing. Also, include information about segmentation criteria for different campaigns. For example, mention the demographics, interests, or purchase history of the target audience. A log of past changes and updates made to campaigns (e.g., subject line rewrites, changes in the call to action) will also let you link your actions to specific outcomes. Finally, set targets for key metrics and display them alongside the actual results. All of these aspects considered will provide context for your data and enable you to extract richer insights.